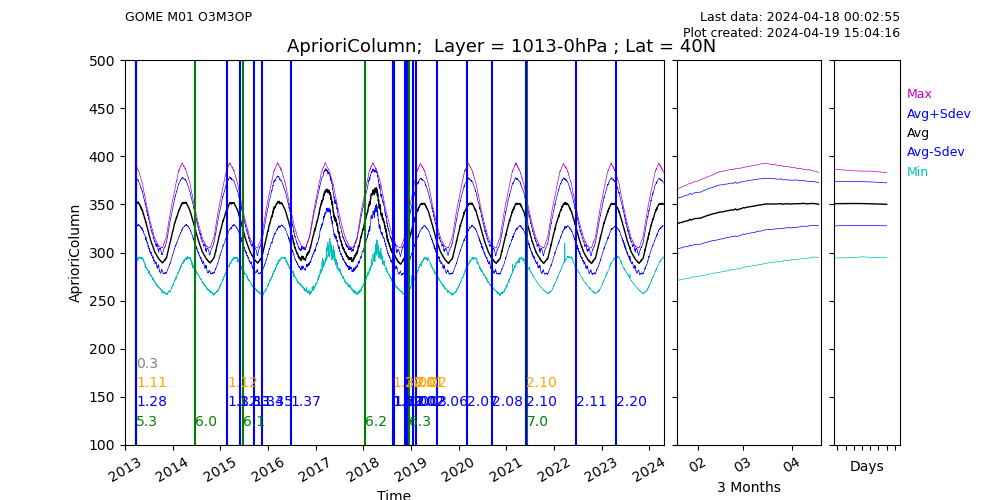
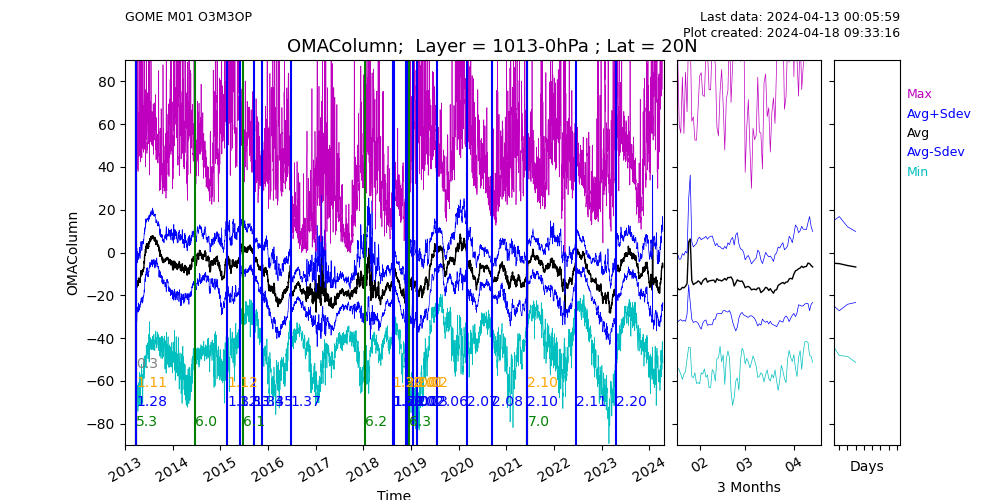
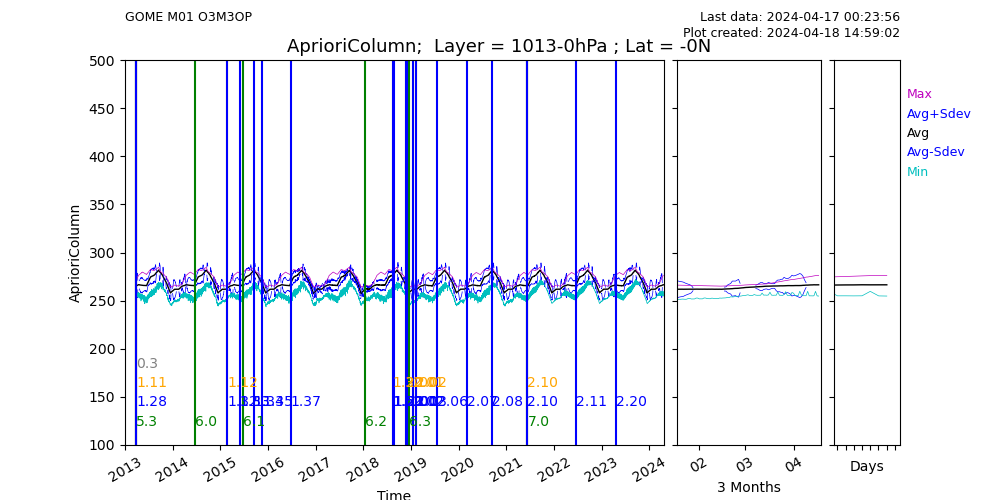
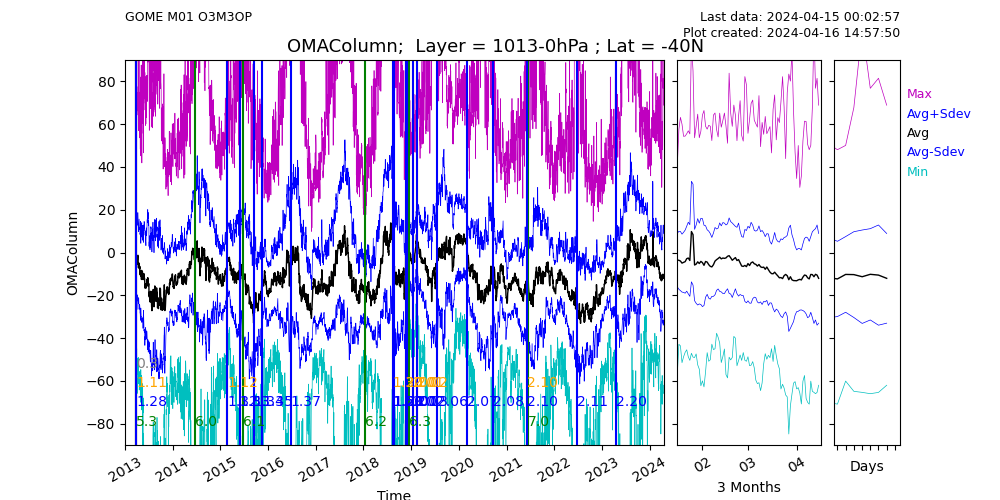
|
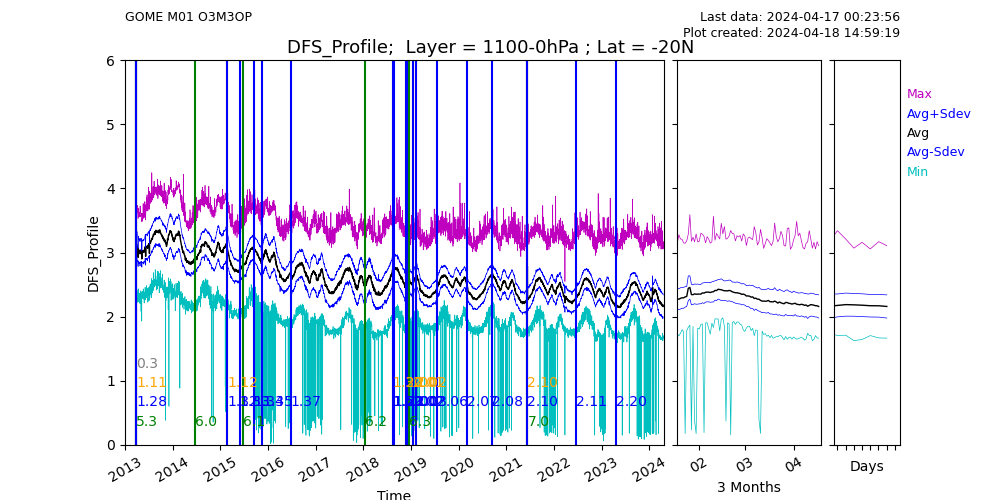
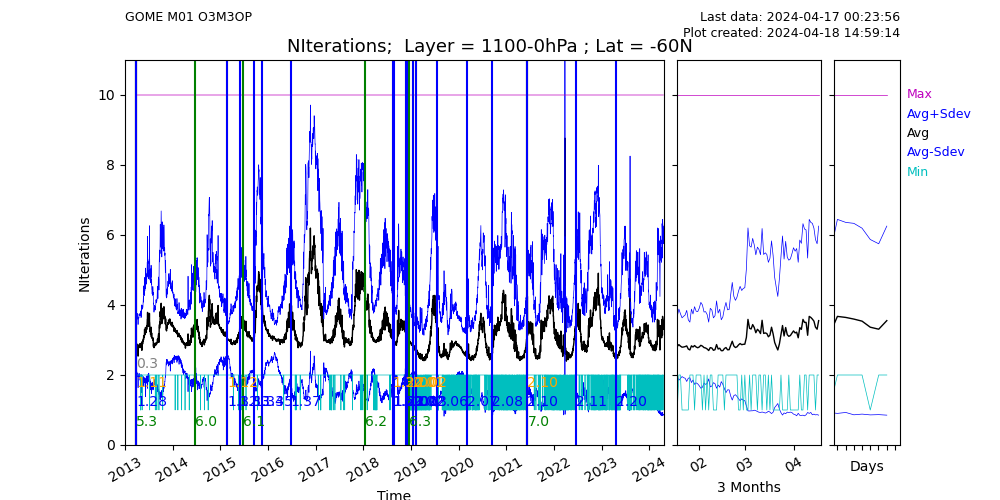
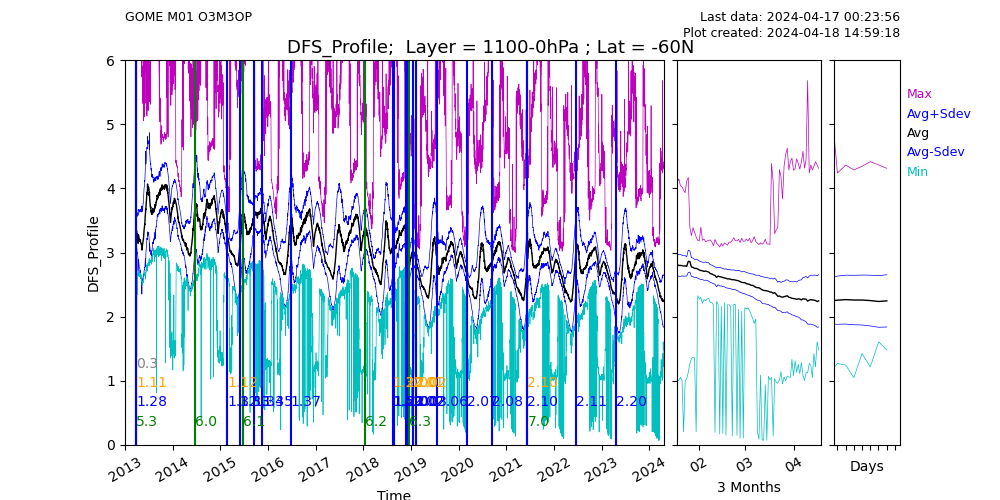
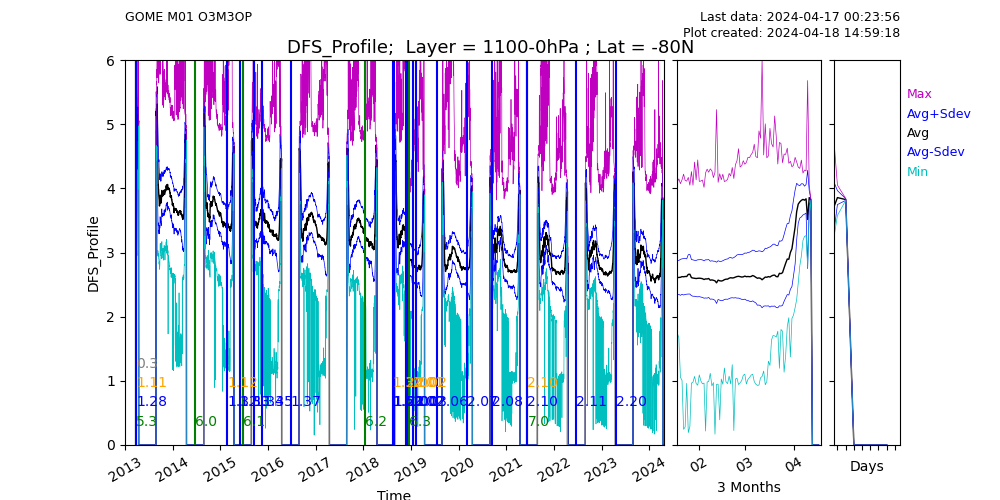
Legend of the parameters shown:
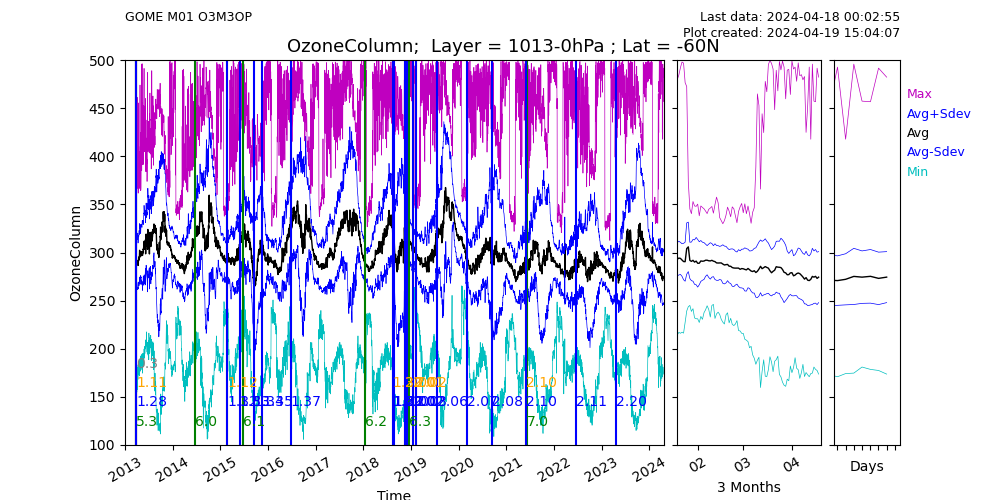
- OzoneColumn: vertically integrated ozone profiles (as a column)
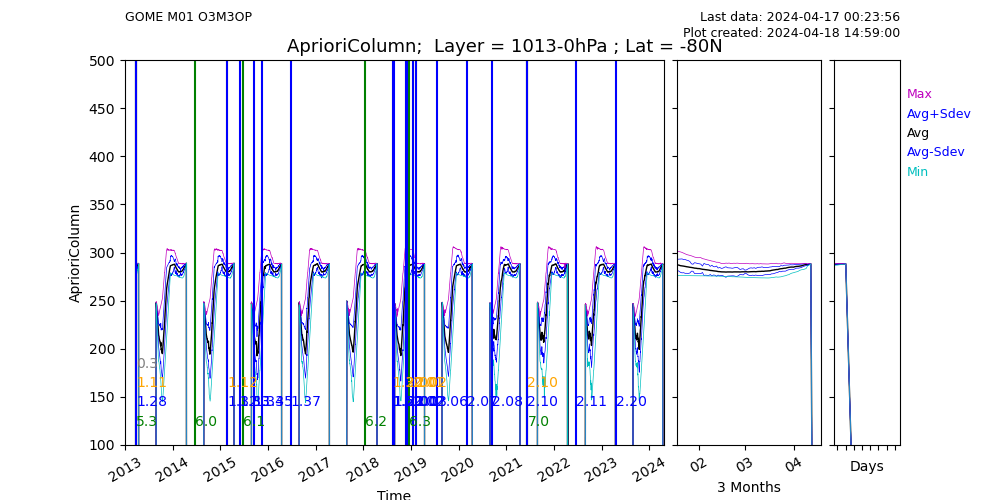
- AprioriColumn: vertically integrated a-priori profiles (as a column)
- OMAColumn: Observation Minus Apriori (the difference between the two columns above)
- NIterations: The averaged number of iterations in the ozone profile retrieval
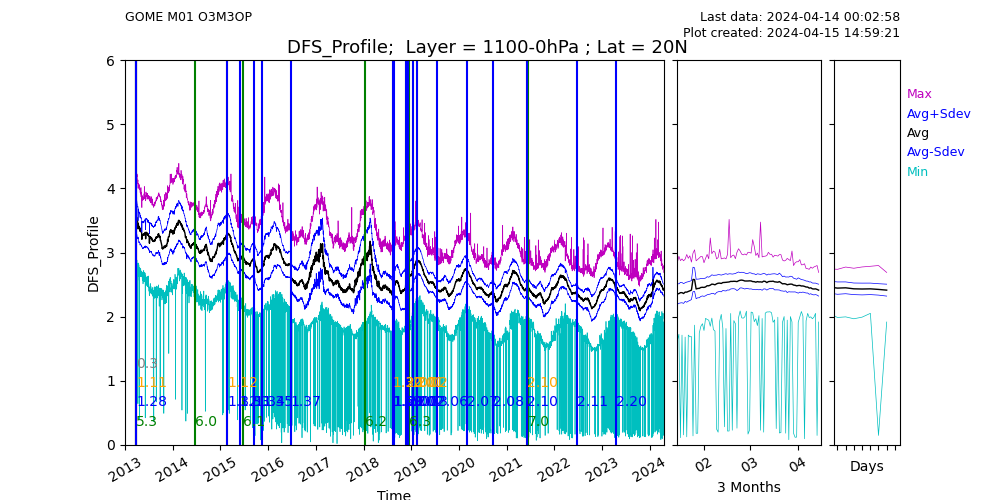
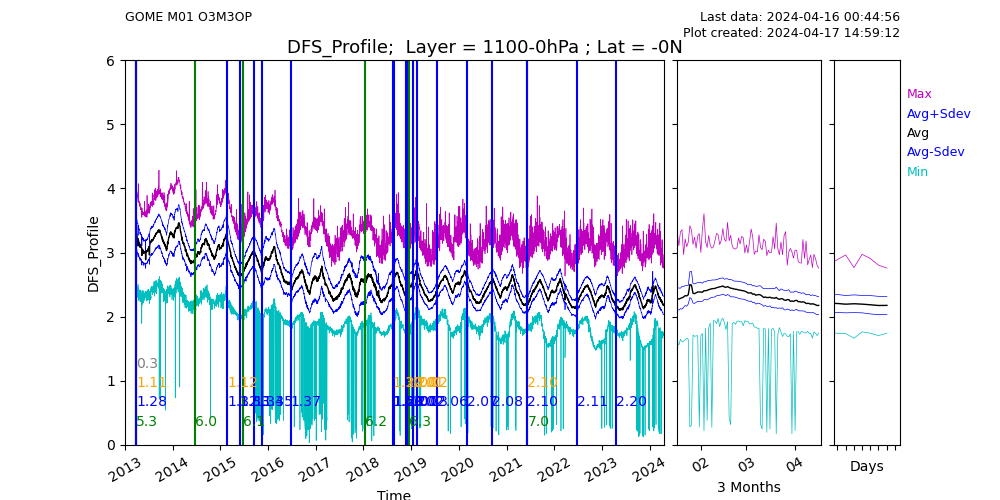
- DFS_Profile: Degrees of Freedom of the vertical ozon profile
- CEAO: Calibration Error / Additional Offset: a fitted correction applied to the radiance in Band-1a
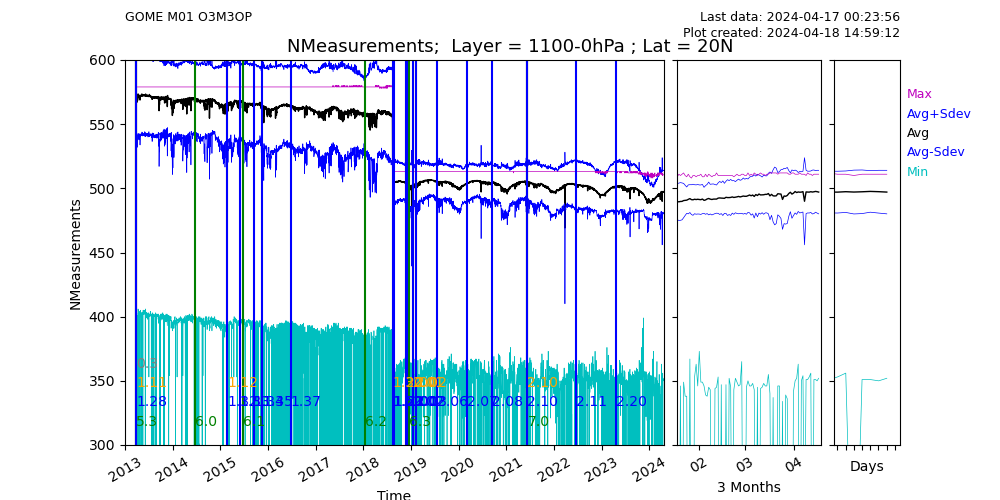
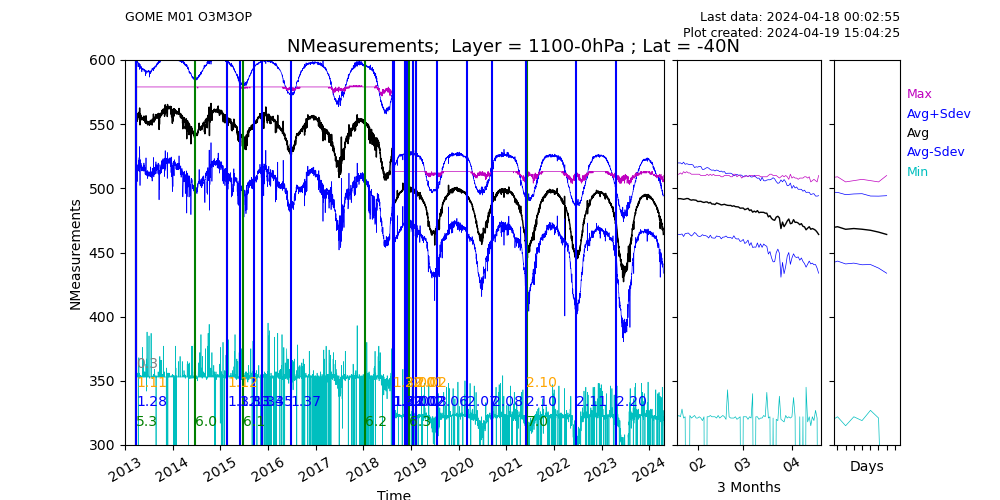
- NMeasurements: The number of spectral detector pixels (i.e. radiance values) used in the retrieval
Color legend time series lines:
- Magenta: Maximum value
- Black: Averaged value
- Blue: Avg + / - Standard Deviation
- Cyan: Minimum value
|
Legend of the colored vertical lines:
- Green: PPF version
- Blue: Software version (PGE)
- Orange: Algorithm version
- Grey: Config version
|


