UV index and UV dose: surface albedo correction
example of difference data version 2.0 and 2.1

UV index and UV dose: surface albedo correction
|

|
| Main data product description page | Surface albedo main page |
Surface albedo correction change
For UV index & dose data versions 2.0 and 2.1 the surface albedo (LER) climatology versions 2.1 and 3.1, respectively, are used, As described on the surface albedo correction page, the UV index & UV dose data are adjusted for the surface albedo based on a surface albedo climatology.For UV index & UV dose data versions 2.0 and 2.1 the surface albedo (LER) climatology versions 2.1 and 3.1, respectively, are used. And as explained on the surface albedo correction page the effect of the change in surface albedo on the UV data can be expressed in a UV_factor, with the largest changes occurring along coast lines and over snow-covered mountain ranges.
The following table gives as example maps for the 15th of January, i.e. using the January climatological albedo values without any interpolation in time. On the left plots for the whole world, on the right for Europe (clicking on an image gives a larger version).
Clearly, the largest changes in the UV occur far North and South, along snow/ice-covered areas where the UV index & UV dose values themselves are low. In addition there may be changes larger than 5% in the UV along some coast lines, over snow-covered mountain ranges and along the edge of the Antarctic (sea-)ice, but all in all these are areas are limited in size, and in most cases the absolute difference in UV index is not larger than 0.3.
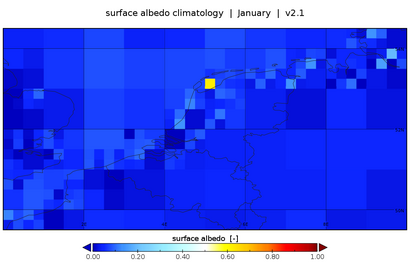
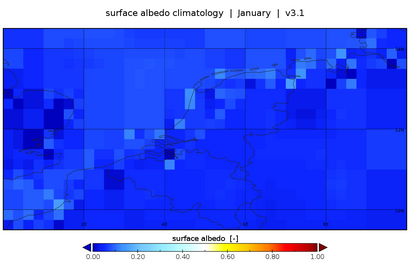
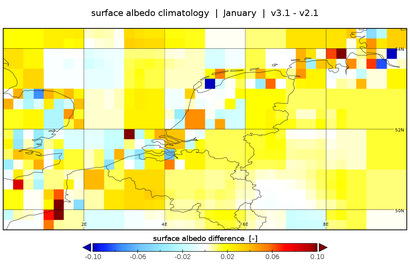
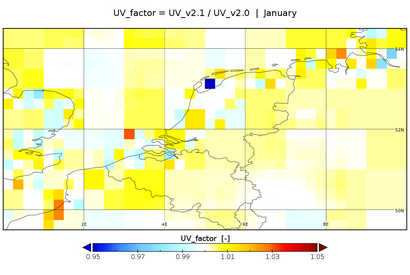
There are also a few singluar points visible, where v2.1 of the albedo climatology clearly had a problem. See, for example, the following detailed plots of The Netherlands and the area around.
The Netherlands 

Surface albedo climatology v2.1 (left) and v3.1 (right) for January 

Surface albedo climatology difference v3.1-v2.1 (left)
and UV_factor = UV_v2.1 / UV_v2.0 (right) for January
- There are other points with similar issues in albedo v2.1, but with smaller differences. See, as example, these two points:
- a) the point in the North Sea at about longitude 3.1° and latitude 51.9°, with A_v2.1 = 0.001 (which is unrealistically small) while A_v3.1 = 0.120, leading to UV_factor = 1.03.
- b) the point south of Eastbourne in the Channel at about longitude 0.4° and latitude 50.6°, with A_v2.1 = 0.013 which A_v3.1 = 0.096. leading to UV_factor = 1.02.
![]() last modified: 4 December 2020
last modified: 4 December 2020
data product contact:
Jos van Geffen & Michiel van Weele &
Ronald van der A
Copyright © KNMI / TEMIS