GOME-2 O3 profile time series

The following plots are based on the coarse resolution NRT vertical ozone profiles of the ACSAF.

The data in the time series plots are averaged values per 10 degree latitude zone. Shown are three plots: all gridded data available, the last three months and the last week of data. Note that the total data record of the GOME-2 ozone profiles goes back to Jan 2007, but this data is not available in the gridded form needed to make these plots.

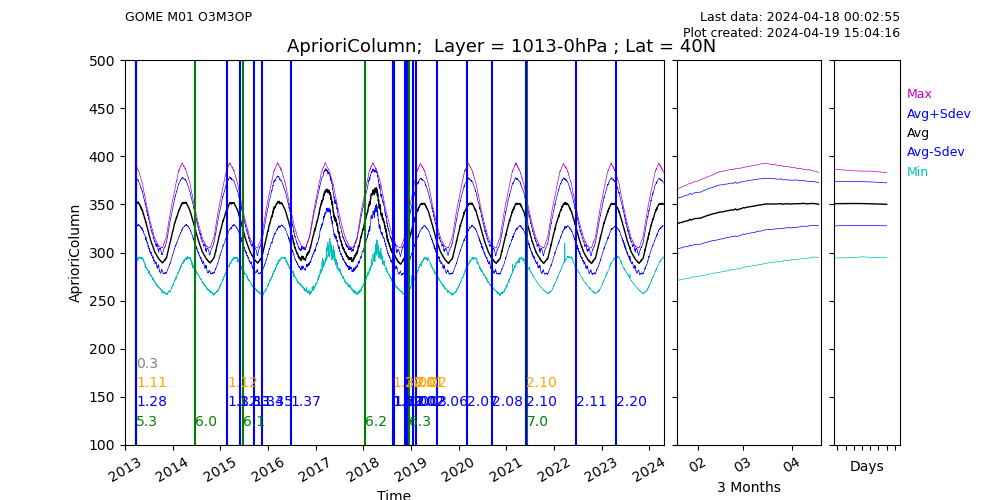
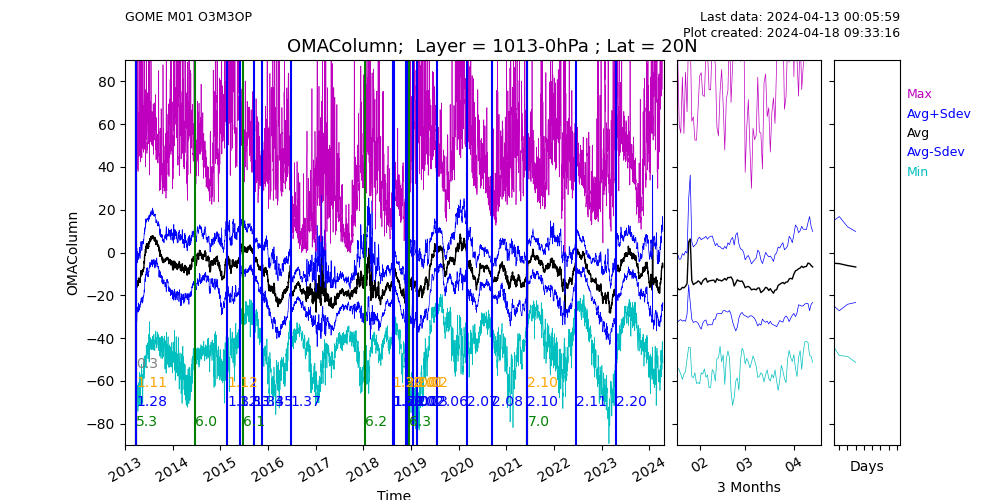
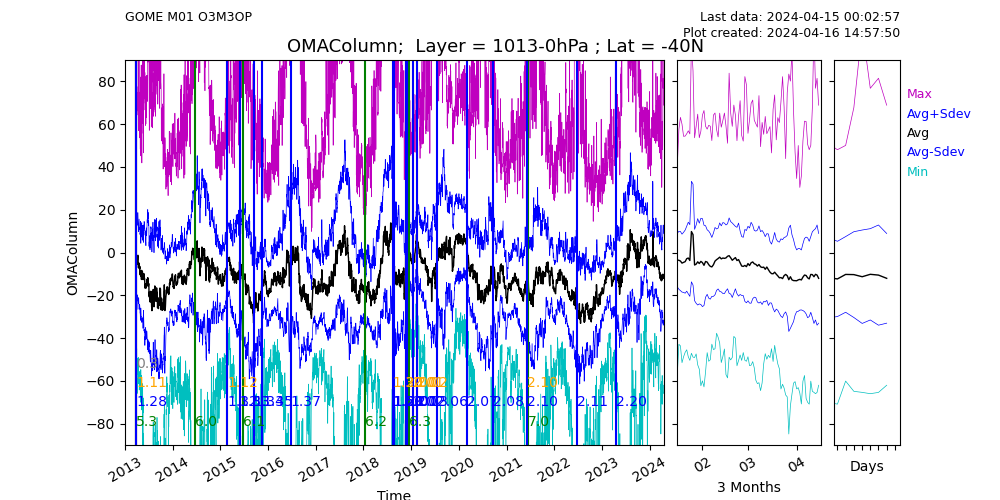
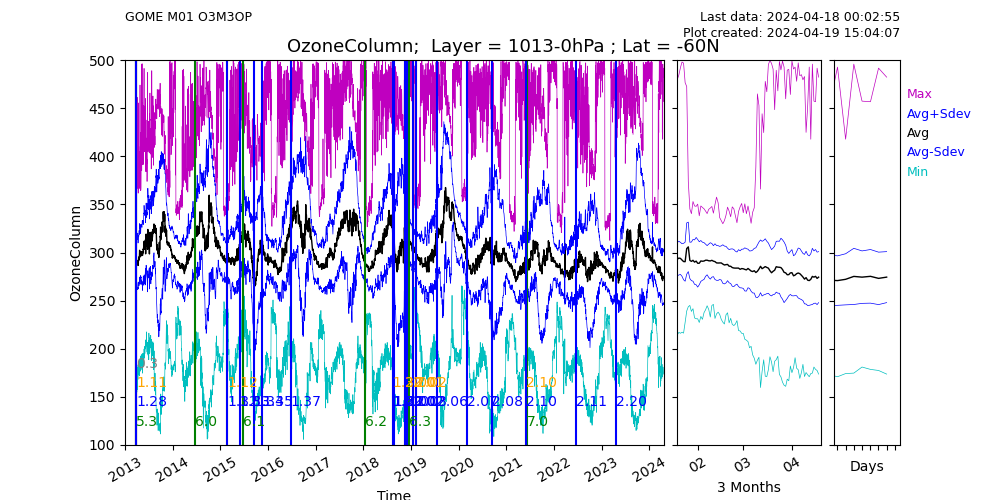
Legend of the parameters shown:

  • OzoneColumn: vertically integrated ozone profiles (as a column)
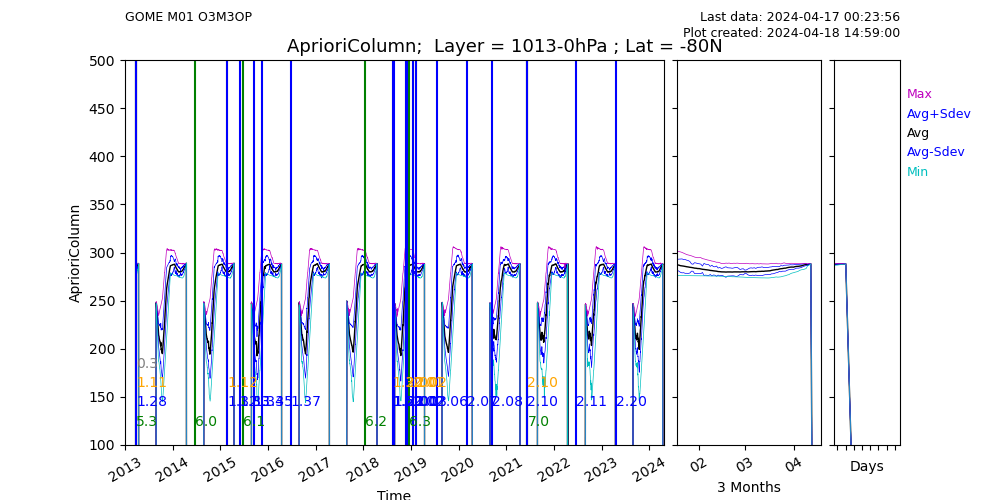
  • AprioriColumn: vertically integrated a-priori profiles (as a column)
  • OMAColumn: Observation Minus Apriori (the difference between the two columns above)
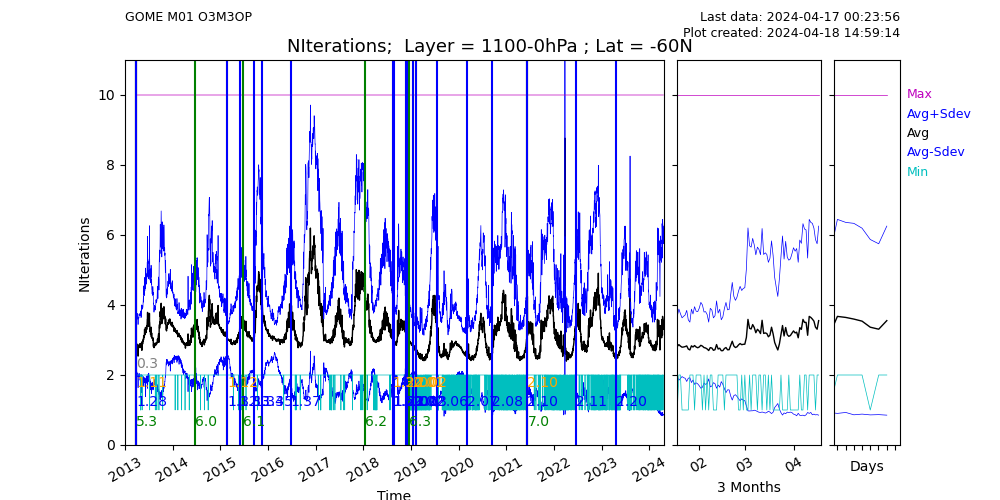
  • NIterations: The averaged number of iterations in the ozone profile retrieval
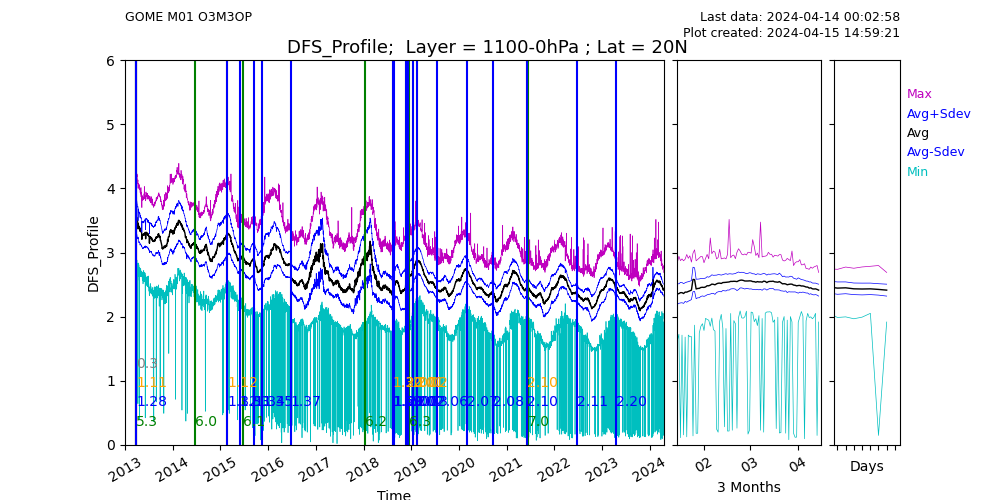
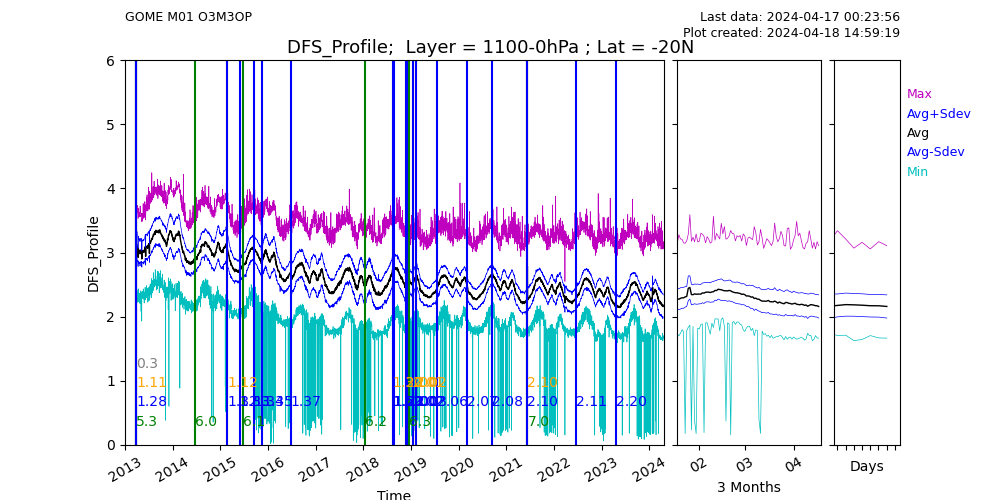
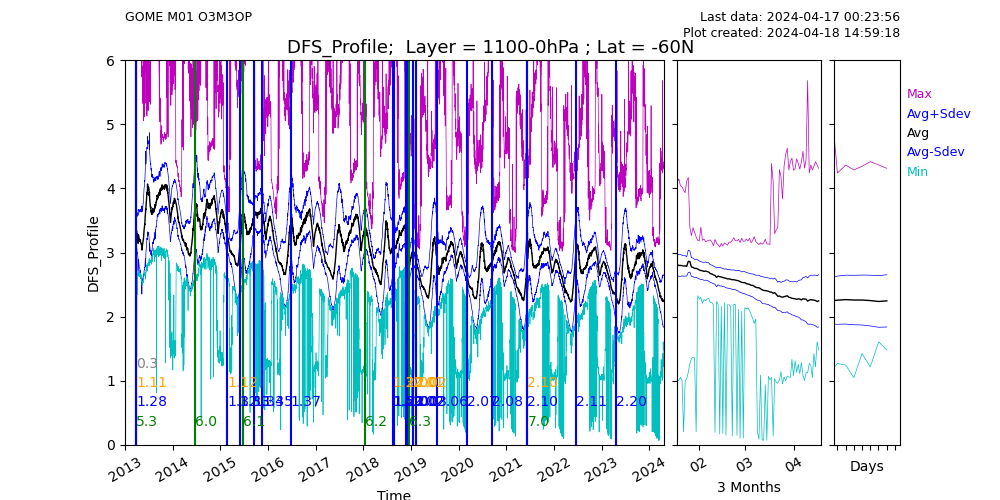
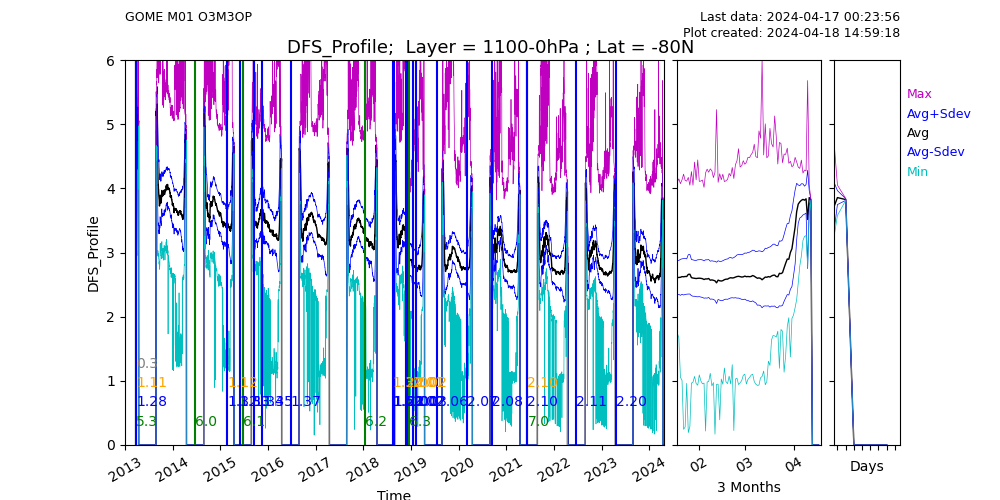
  • DFS_Profile: Degrees of Freedom of the vertical ozon profile
  • CEAO: Calibration Error / Additional Offset: a fitted correction applied to the radiance in Band-1a
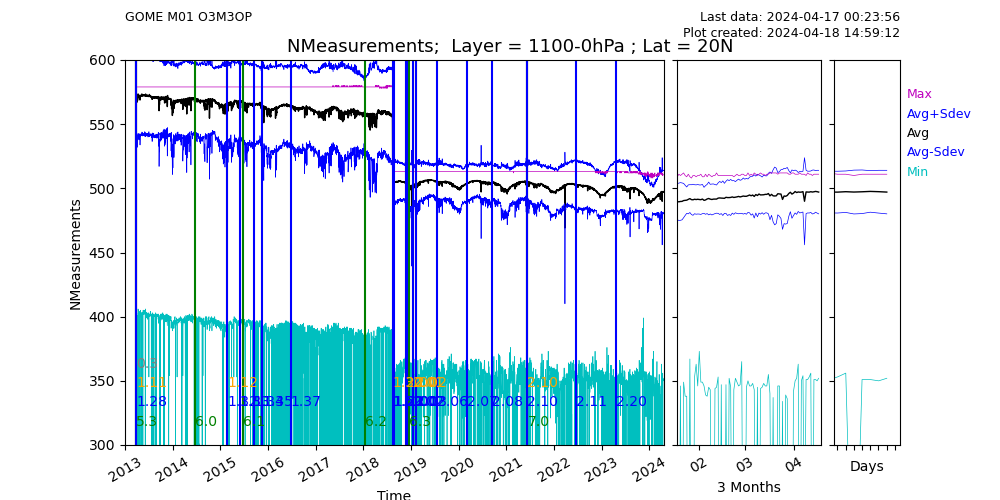
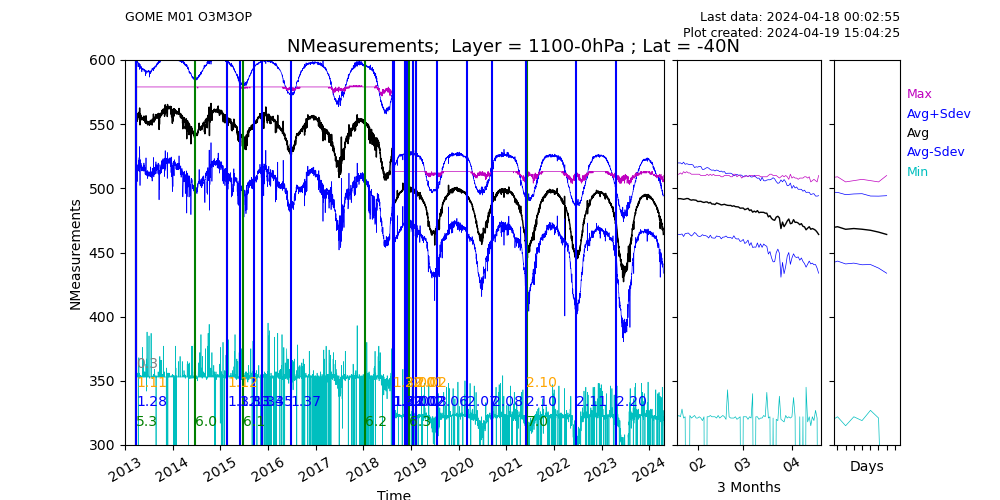
  • NMeasurements: The number of spectral detector pixels (i.e. radiance values) used in the retrieval

Color legend time series lines:

  • Magenta: Maximum value
  • Black: Averaged value
  • Blue: Avg + / - Standard Deviation
  • Cyan: Minimum value

Legend of the colored vertical lines:

  • Green: PPF version
  • Blue: Software version (PGE)
  • Orange: Algorithm version
  • Grey: Config version

Please take note of the position of event markers


 OzoneColumnAprioriColumnOMAColumn
80N
60N
40N
20N
-0N
-20N
-40N
-60N
-80N

 NIterationsDFS_ProfileCEA0
80N
60N
40N
20N
-0N
-20N
-40N
-60N
-80N

 NMeasurements
80N
60N
40N
20N
-0N
-20N
-40N
-60N
-80N

Note on time series markers

During the processing / plotting the system looks for changes in L1b, PGE and other variables describing the system. In the creation of the gridded / averaged parameters, the first value of the L1b or PGE version is saved. During a day this version may change. Only one day later this version will be recorded in the gridded product and will then be shown on the plots. Effectively this means that time series event markers mark one day later than the actual change.